
ShoreCast
Dr. Peter Raimondi, Professor in the Institute of Marine Sciences, UC Santa Cruz
ShoreCast visualizes how sea-level rise will reshape California's rocky intertidal habitat, built for the Raimondi Lab and hosted on UC Santa Cruz's MARINe network.
Problem Statement
California's rocky intertidal habitat is set to shift as sea levels rise, but the data that described that risk was not accessible outside of a select few researchers. Coastal managers needed a way to see, site by site, how the habitat and species monitored today will change with sea level rise, without waiting for a new round of custom analysis.
Collaboration
We built ShoreCast with the Raimondi Lab at UC Santa Cruz, which supplies the long-term rocky-intertidal survey data behind the model. The tool now runs embedded on MARINe, the UC Santa Cruz network that coordinates intertidal monitoring, and the California State Coastal Conservancy hosted a public webinar walking coastal managers through it.
Technical Approach
A slider turns sea-level rise into visible habitat change
Users drag a slider through 21 steps from 0 to 2 meters of sea-level rise and watch projected habitat loss move along the coast in real time. The steps are not tied to any particular year, so planners can explore whatever rise scenario matters to their site.
Mapbox GL · WebGL
Three nested scales keep one prediction consistent
ShoreCast nests three spatial scales: roughly 30 to 50 kilometer ocean-model cells, habitat segments along the shoreline, and 1-meter species-probability forecast points. Zooming from the regional model down to a single point keeps the same underlying prediction consistent at every scale.
ROMS ocean model · Mapbox GL
Animated arcs show where larvae travel along the coast
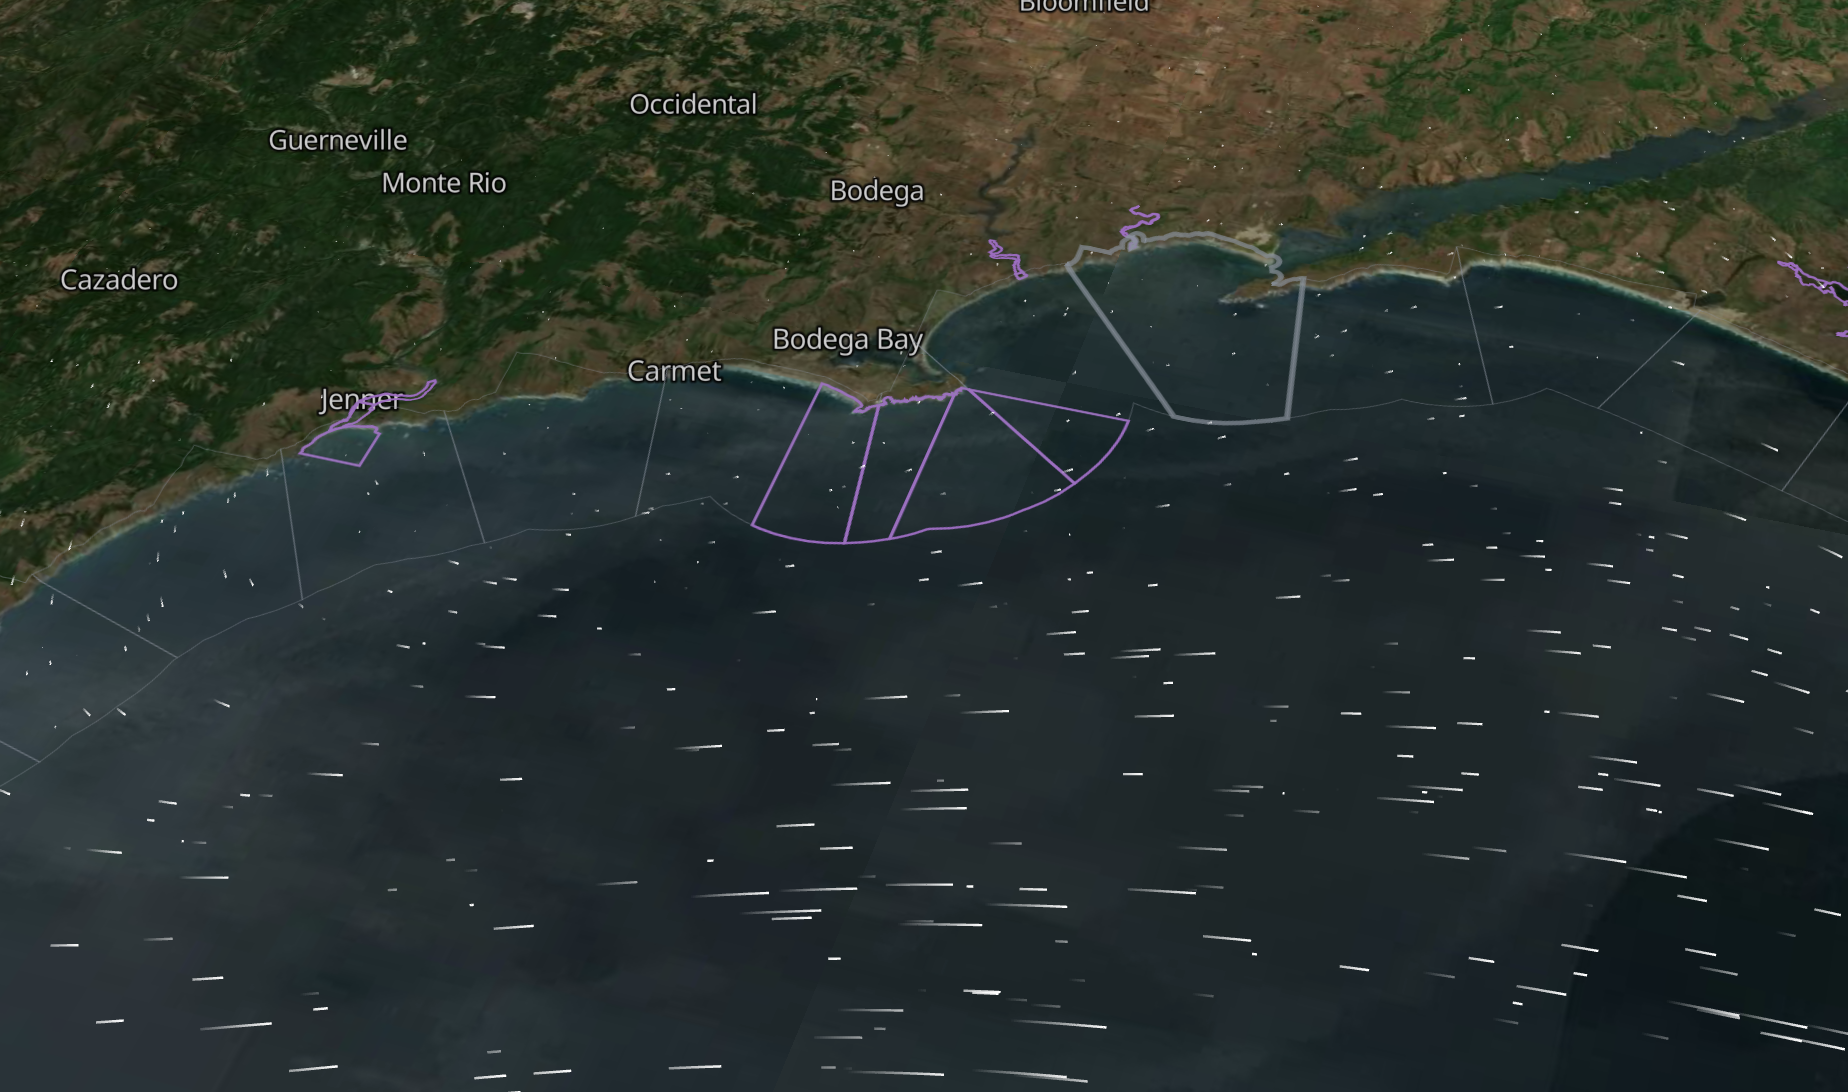
Contribution arcs show which stretches of coast supply larvae and spores to which others, from ROMS ocean-current particle tracking. We wrote a custom deck.gl shader that animates glowing dots along each arc, faster and denser for stronger connections, so species transport reads clearly across a complex multidimensional dataset.
deck.gl · GLSL · ROMS ocean model
Results
- ShoreCast runs embedded on UC Santa Cruz's MARINe network and as a standalone app.
- The California State Coastal Conservancy hosted a public webinar on the tool in June 2026.
- Coastal managers in California and Oregon use it to compare habitat vulnerability by site.
Who uses it
California State Coastal Conservancy
Hosts public training on ShoreCast and backs it as a planning tool for sea-level rise on California's rocky coast.
Coastal resource managers in California and Oregon
State and federal managers compare habitat vulnerability by site and upload their own site boundaries for local planning.
Raimondi Lab and MARINe, UC Santa Cruz
Supply the long-term rocky intertidal survey data behind the model and host ShoreCast on marine.ucsc.edu.
The public
Explore the embedded tool and its plain-language explanations on MARINe's public site.
Workshops and events
Workshop · June 2026
ShoreCast webinar and workshop, California State Coastal Conservancy
A public online session with hands-on breakout rooms. The Raimondi Lab explained how the model is built, and we walked attendees through site priority scores and custom site uploads.